
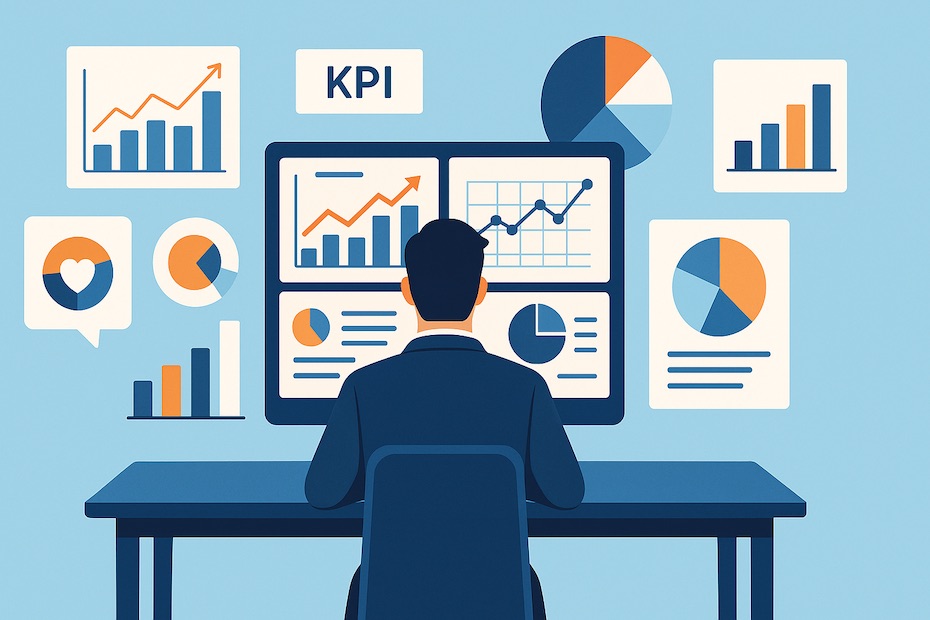
You strengthen business decisions when you measure key performance indicators that cover financial health, customer loyalty, operational efficiency, and team engagement. Tracking these consistently helps you act faster and lead smarter.
This article explains the 10 most important KPIs that you, as a business leader, must monitor. You’ll learn what each means, why it matters, and how to use the data to guide growth and protect profitability.
1. Revenue Growth
Revenue growth is your most direct measure of market traction and sales effectiveness. It shows how fast your top line expands over weeks, months, or years.
You should track not only total revenue but also revenue segmented by product, region, or channel. This helps you pinpoint which areas drive growth and which lag behind. For instance, subscription models may grow faster than one-time sales, which influences pricing and marketing strategies.
If growth slows, assess your sales funnel, lead generation, and pricing. Revenue trends highlight whether your strategy is effective or needs immediate adjustment.
2. Gross Profit Margin
Gross profit margin measures how efficiently you turn sales into profit after direct costs. It answers whether you’re producing and delivering your product or service profitably.
To calculate, subtract cost of goods sold (COGS) from revenue, then divide by revenue. The percentage reflects efficiency. A shrinking margin signals rising production costs, discounts eating into profits, or poor supplier terms.
Monitoring gross margin allows you to negotiate better vendor contracts, streamline supply chains, or raise prices strategically. Strong margins give you room to reinvest in growth.
3. Net Profit Margin
While gross margin focuses on production, net profit margin shows your bottom-line health after all expenses—salaries, rent, interest, and taxes. This is the ultimate indicator of profitability.
Leaders often overlook hidden costs that quietly reduce net margins. Regular reviews help you uncover bloated overhead, inefficiencies, or underperforming units.
High net margins signal disciplined operations. Low margins indicate the need for restructuring or sharper cost control. This KPI helps you ensure that growth translates into actual profits, not just revenue.
4. EBITDA Margin
EBITDA margin isolates operating profitability before interest, taxes, depreciation, and amortization. This strips away accounting adjustments to show how effectively you run the core business.
Private equity firms and investors rely heavily on EBITDA because it provides a clear picture of operational performance. It levels the playing field when comparing companies in the same industry.
As a leader, this metric tells you if your business model itself is healthy. If EBITDA shrinks, operational inefficiency—not taxes or financing—is likely the cause.
5. Net Promoter Score (NPS)
Net Promoter Score tracks customer loyalty by asking how likely clients are to recommend you on a 0–10 scale. Promoters (9–10) drive referrals, while detractors (0–6) damage your reputation.
A high NPS correlates with higher customer retention and organic growth. It provides a quick pulse on whether customers are advocates or critics.
Use NPS surveys after key touchpoints—purchases, onboarding, or support interactions. If scores fall, analyze themes in feedback and adjust your service quality or product experience.
6. Customer Satisfaction (CSAT) and Retention
Customer Satisfaction (CSAT) measures short-term happiness with an interaction, while Customer Retention Rate reveals how many customers stay with you over time. Together, they provide a powerful view of loyalty.
Satisfied customers may still churn if retention systems fail. Tracking both ensures you’re measuring perception and behavior. Retention is especially vital in subscription or SaaS models.
Improving retention increases lifetime value (LTV) and lowers reliance on constant new acquisition. Loyal customers spend more, advocate for your brand, and stabilize revenue streams.
7. Customer Acquisition Cost (CAC)
Customer Acquisition Cost measures the average cost of winning a new customer. It includes sales, marketing, and related expenses.
A low CAC relative to LTV indicates efficient growth. A high CAC signals over-spending on channels that don’t convert or retain.
By tracking CAC by campaign, you see which marketing investments deliver return. This data allows you to reallocate budget toward profitable channels and refine messaging for better ROI.
8. Operational Efficiency Metrics
Operational KPIs uncover bottlenecks and resource waste. Key measures include Accounts Receivable Turnover, Current Ratio, and Utilization Rate.
- Accounts Receivable Turnover shows how quickly you collect cash. Faster cycles strengthen liquidity.
- Current Ratio and Quick Ratio tell you whether you can meet short-term obligations.
- Utilization Rate reveals how well your workforce is allocated toward productive work.
Leaders who monitor these indicators catch problems early—like slow-paying clients, resource misallocation, or poor cash flow management—before they escalate.
9. Employee Engagement and Retention
Your workforce drives execution, so HR KPIs deserve equal weight. Employee Retention Rate and Engagement Score reveal organizational health.
High turnover increases recruitment costs and drains institutional knowledge. Low engagement correlates with poor performance, absenteeism, and disengagement.
Track employee sentiment through surveys, performance metrics, and turnover data. Address dips with development programs, recognition initiatives, or career progression paths. An engaged team sustains long-term performance.
10. Market Share and Innovation Indicators
Future growth depends on your ability to capture market share and innovate. Tracking market share shows how well you compete against rivals.
Couple this with Capital Investment Efficiency and Product Adoption Metrics. These reveal whether your investments in R&D, technology, or new features translate into customer value and revenue.
If market share stagnates, revisit differentiation strategies. If innovation doesn’t generate adoption, refine execution or customer education. Monitoring these KPIs positions you to stay relevant and future-ready.
Essential KPIs Every Business Leader Should Track
- Revenue growth and margins
- EBITDA and net profit
- NPS, CSAT, and retention
- Customer acquisition cost
- Operational efficiency ratios
- Employee retention and engagement
- Market share and innovation
In Conclusion
Your leadership becomes sharper when you measure across finance, customers, operations, people, and growth. These 10 KPIs create a balanced scorecard—revealing profitability, efficiency, loyalty, and future readiness. By tracking them consistently, you align teams with strategy, anticipate problems early, and build lasting success.
Get more leadership and performance insights on Substack.

Jeffrey Wendel leads business development at Carts and Parts, a top E-Z-GO golf car dealership in Union City, IN. With more than three decades in powersports retail and small-business growth, he specializes in financing, customer experience, and marketing—and also coaches owners on scalable strategies. He is the author of Grand Slam Retirement.